Grid
The grid is a very powerful tool for viewing, filtering, and manipulating data. Here are a few different features that are built in.
Search
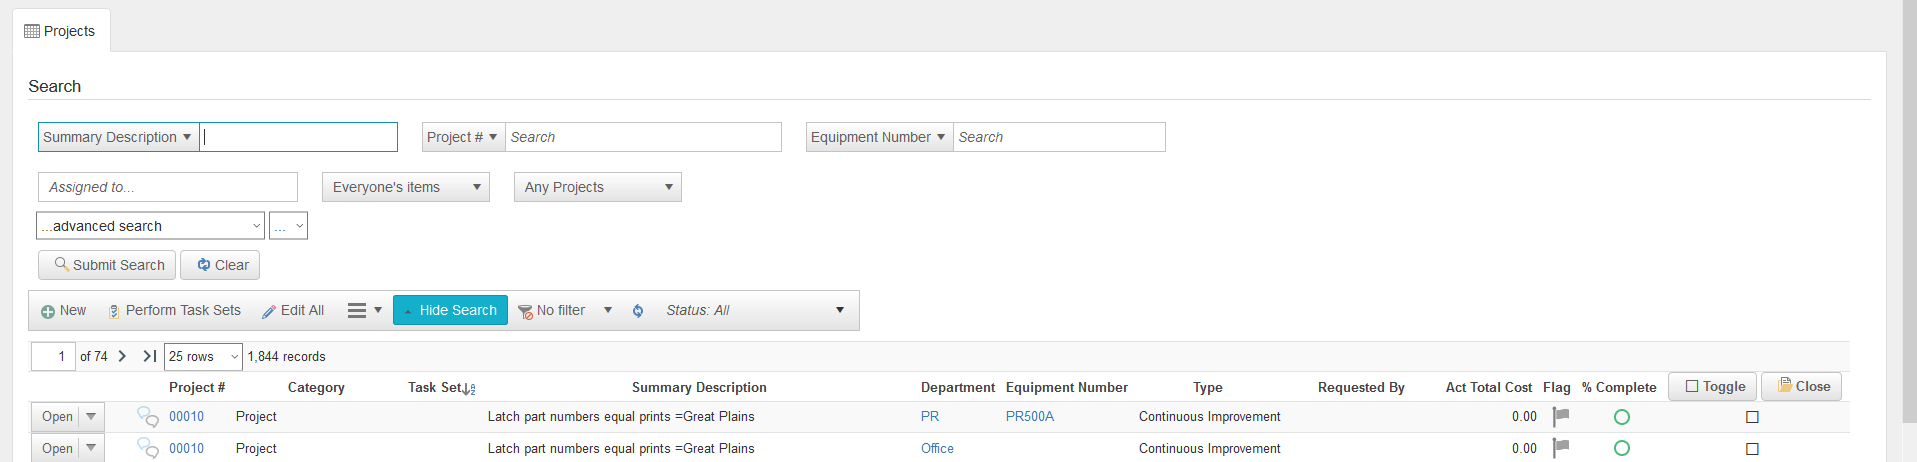
By clicking the Show Search button, you are presented with fields that allow you to be specific with what information you are searching for. In this case, we’re viewing a project page which not only allows us to search information on the project, but also filter who those are assigned to. You’ll notice the ...advanced search dropdown. This option will allow you to get even more specific with your search terms.
Filtering
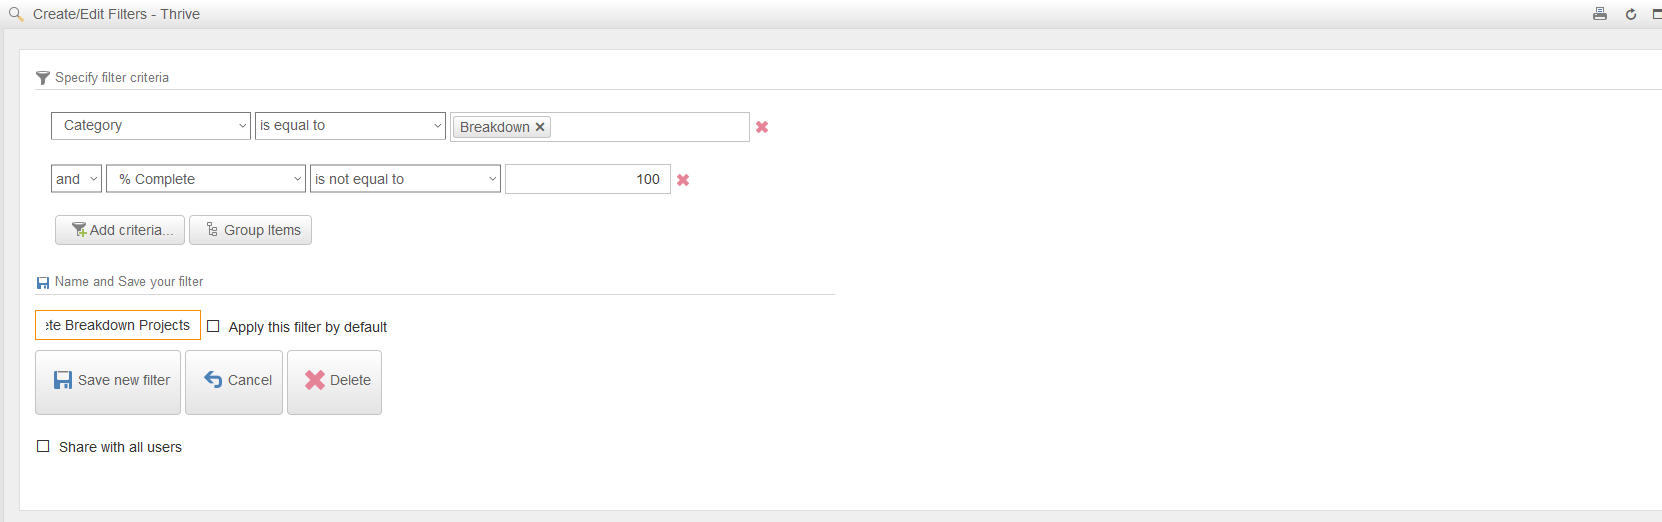
While searching to find your data works, sometimes you want to save those search terms. Filters allow you show information that you dictate. For example, in the image below we are creating a filter that will only show us items with a Category of breakdown that are not complete.
Options
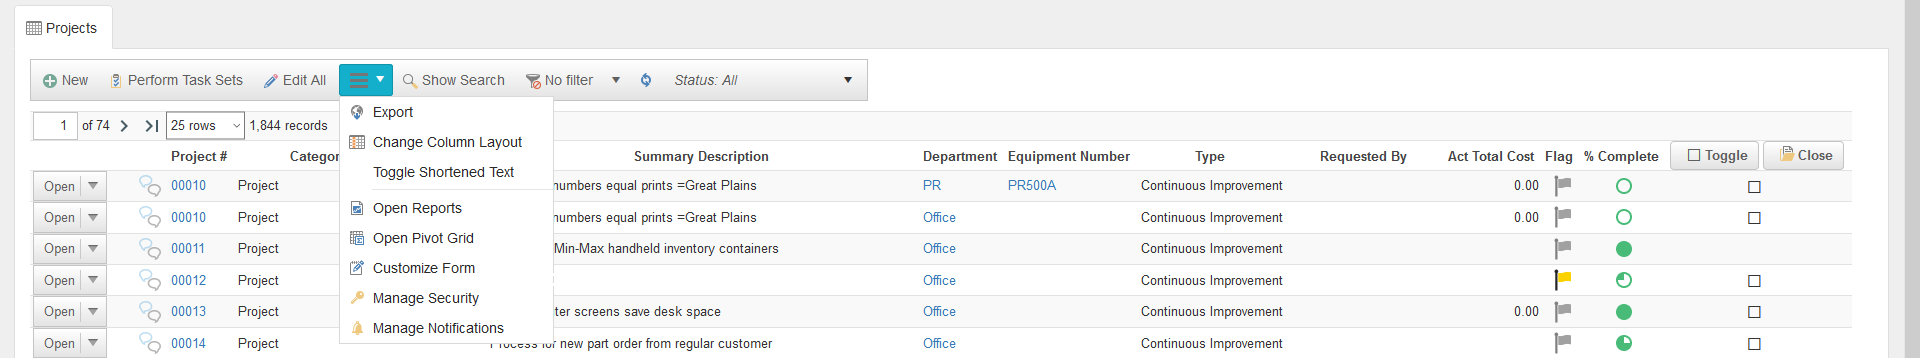
The Hamburger Menu as we like to call it holds links to pages that have a relationship with the grid you are viewing. For example, if you wish to open reports based on the grid you are on, simply click “Open Reports” and it will automatically filter it to the data you are viewing. If you wish to Manage security or notifications for this table, it operates the same way.
In addition, users will often want to change their column layout to see specific information that is relevant to them. See the explanation below of how to do that.
Column Layouts
Many data sets in Thrive may be viewed in the list (aka grid) view and also in a detailed view. While in the list (grid) view of a Thrive web form, it may be useful to change the default list of fields being displayed or the order in which the columns are arranged.